 SnowScope
Alps: where it will snow and where it will rain, 8 to 10 November
Rain and snow return to the Alps from Monday, but the air is mild. From 8 to 10 November the snow line should sit mostly between 2,190 and 2,850 m, so valleys and the lower ski slopes get rain while the glaciers and the highest summits get snow.
See the live snow forecast for Andermatt in the SnowScope appSnow depth, powder alerts and the 3D map, free.
The snow line against the mountains
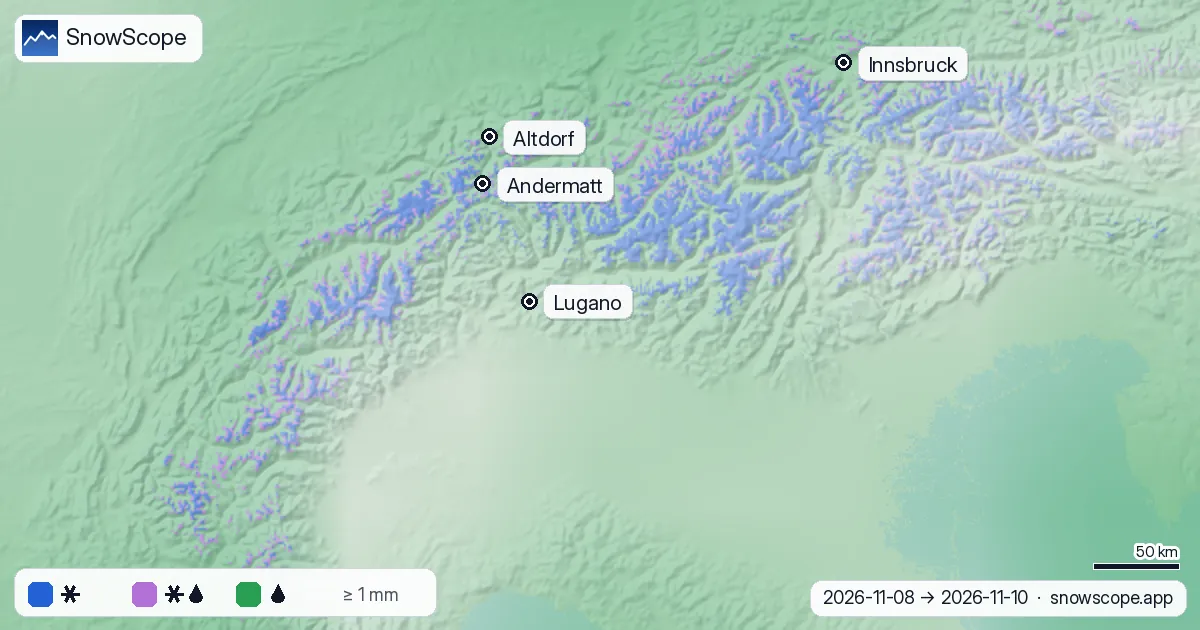
Our new map compares the forecast snow line with the real terrain, hour by hour, and colours each slope by what falls on it: blue for snow, lilac for wet snow or sleet, green for rain.
Above about 3,000 m, 90 % of the precipitation should fall as snow. At 2,500 m it is a three-way split: 31 % snow, 38 % wet snow or sleet and 31 % rain. At 2,000 m, 88 % falls as rain, and lower down practically all of it. The middle of the snow line over the wet hours is 2,540 m.

Show the numbers
| Height (m) | Snow % | Wet snow / sleet % | Rain % |
|---|---|---|---|
| 500 | 0 | 0 | 100 |
| 750 | 0 | 0 | 100 |
| 1,000 | 0 | 0 | 100 |
| 1,250 | 0 | 0 | 100 |
| 1,500 | 0 | 1 | 99 |
| 1,750 | 1 | 3 | 96 |
| 2,000 | 2 | 10 | 88 |
| 2,250 | 10 | 26 | 64 |
| 2,500 | 31 | 38 | 31 |
| 2,750 | 62 | 33 | 5 |
| 3,000 | 90 | 10 | 0 |
| 3,250 | 100 | 0 | 0 |
| 3,500 | 100 | 0 | 0 |
| 3,750 | 100 | 0 | 0 |
| 4,000 | 100 | 0 | 0 |
Place by place
At Andermatt (top 2,963 m) the forecast gives 27 mm of precipitation from 8 to 12 November. During the wet hours the 0 °C level stands near 2,730 m, which puts the snow line near 2,430 m: snow on the upper runs, rain lower down.
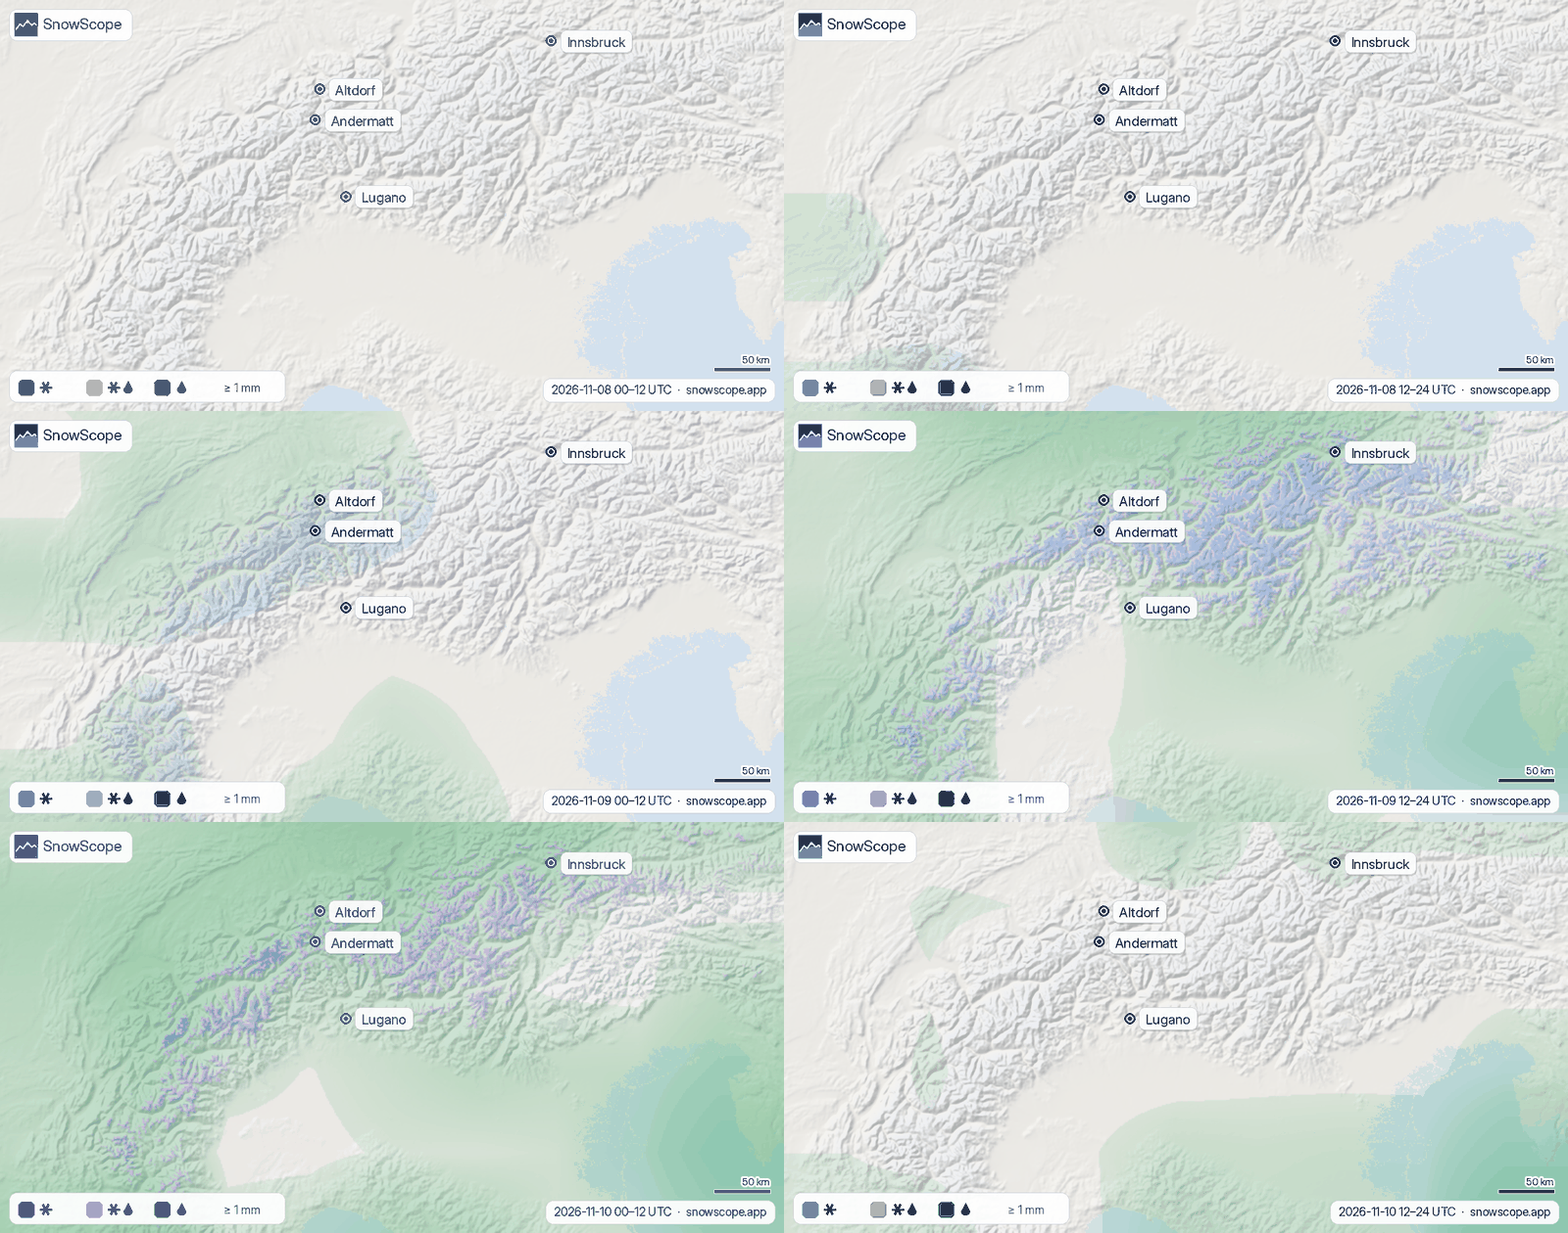
In the valleys it is rain: 36 mm at Altdorf on the north side, 23.6 mm at Lugano in the south and 16.4 mm at Innsbruck. The chart of rain per day shows that most of it comes on 9 and 10 November.

Show the numbers
| Date | Andermatt (mm) | Altdorf (mm) | Lugano (mm) | Innsbruck (mm) |
|---|---|---|---|---|
| 8 November * | 0.0 | 0.0 | 0.3 | 0.0 |
| 9 November * | 6.2 | 11.3 | 0.3 | 2.4 |
| 10 November * | 8.5 | 16.6 | 3.6 | 6.9 |
| 11 November * | 2.3 | 0.3 | 1.5 | 0.0 |
| 12 November * | 10.0 | 7.8 | 17.9 | 7.1 |
Why it rains so high
Air cools by about 6.5 °C for every kilometre of height. Snowflakes falling through air warmer than 0 °C start to melt, and because melting takes time they usually turn to rain about 300 m below the 0 °C level. That is where we draw the snow line, with a band of wet snow 150 m either side of it.
When a mild air mass comes in from the south-west, the 0 °C level climbs and the whole picture moves up the mountains. The animation shows the same map in 12-hour steps, so you can see when the snow line rises and falls.
What it means for you
- Forecasts change: check the live snow map again before you go.
- Wet, heavy snow on the glaciers can be unstable: off-piste, always read the official avalanche bulletin.
- For lower resorts, rain on thin early snow usually means waiting for the next cold spell.
References and credits
- Minder, J. R., Durran, D. R. and Roe, G. H. (2011). Mesoscale controls on the mountainside snow line. Journal of the Atmospheric Sciences 68, 2107-2127. doi.org/10.1175/JAS-D-10-05006.1
- NOAA, NASA, US Air Force (1976). U.S. Standard Atmosphere, 1976 (temperature falls 6.5 °C per km in the lower atmosphere). NASA-TM-X-74335. ntrs.nasa.gov/citations/19770009539
- American Meteorological Society, Glossary of Meteorology: 'Freezing level'. glossary.ametsoc.org/wiki/Freezing_level
- American Meteorological Society, Glossary of Meteorology: 'Melting layer'. glossary.ametsoc.org/wiki/Melting_layer
- Wallace, J. M. and Hobbs, P. V. (2006). Atmospheric Science: An Introductory Survey, 2nd edition. Academic Press / Elsevier. ISBN 978-0-12-732951-2.
- Open-Meteo.com forecast API, ECMWF IFS 0.25° model (CC BY 4.0): hourly precipitation and temperature on pressure levels. open-meteo.com/en/docs/ecmwf-api
- SnowScope snow model and forecast maps (SnowScope, Atlas Labs). snowscope.app/
About these numbers
Forecast of 7 November (ECMWF IFS via Open-Meteo): hourly precipitation and the temperature profile on 8 pressure levels at 54 points over the Alps. The 0 °C level is computed from the profile; snow line = 0 °C level minus 300 m, wet snow within 150 m of it. Interpolated between the points onto the terrain, so local effects (valley inversions, heavy showers) are not resolved. Forecasts change.
Cite this report
For research, teaching or the press: the numbers and charts are free to reuse under CC BY 4.0 with this citation.
SnowScope (2026), Alps: where it will snow and where it will rain, 8 to 10 November, https://snowscope.app/blog/en/2026/11/alps-where-it-snows-where-it-rains-8-10-november-2026.html, accessed 2026-11-08
SnowScope (Atlas Labs). (2026, November 8). Alps: where it will snow and where it will rain, 8 to 10 November. SnowScope snow reports. https://snowscope.app/blog/en/2026/11/alps-where-it-snows-where-it-rains-8-10-november-2026.html
BibTeX
@misc{snowscope2026alpswhereitsnowswhereitr,
  author       = {{SnowScope (Atlas Labs)}},
  title        = {Alps: where it will snow and where it will rain, 8 to 10 November},
  year         = {2026},
  month        = nov,
  howpublished = {\url{https://snowscope.app/blog/en/2026/11/alps-where-it-snows-where-it-rains-8-10-november-2026.html}},
  note         = {Published 2026-11-08 10:53 UTC; accessed 2026-11-08}
}· CC BY 4.0 · Methods, data and tools →
Follow Andermatt
Free: a message when fresh snow is coming, and the forecast every morning.

More snow reports
Three ways to spend a day from Méribel: east to Courchevel, south towards Val Thorens, or at home on Mont Vallon, with the snow of 46 past winters at three heights.
Les Menuires snow report for 13 November 2026: 28 cm at the top (2838 m), none lying at 2112 m or 1386 m. About 80 cm due at the top in seven days, snow line around 1500 to 1700 m. Why Val Thorens, 450 m higher up the same valley, already has more.
Is Verbier good for beginners? When is the snow best? How do you get there? Answers from the 4 Vallées and 46 past winters of snow data.