 SnowScope
High Atlas: rain up to about 3,710 m – only the highest summits turn white
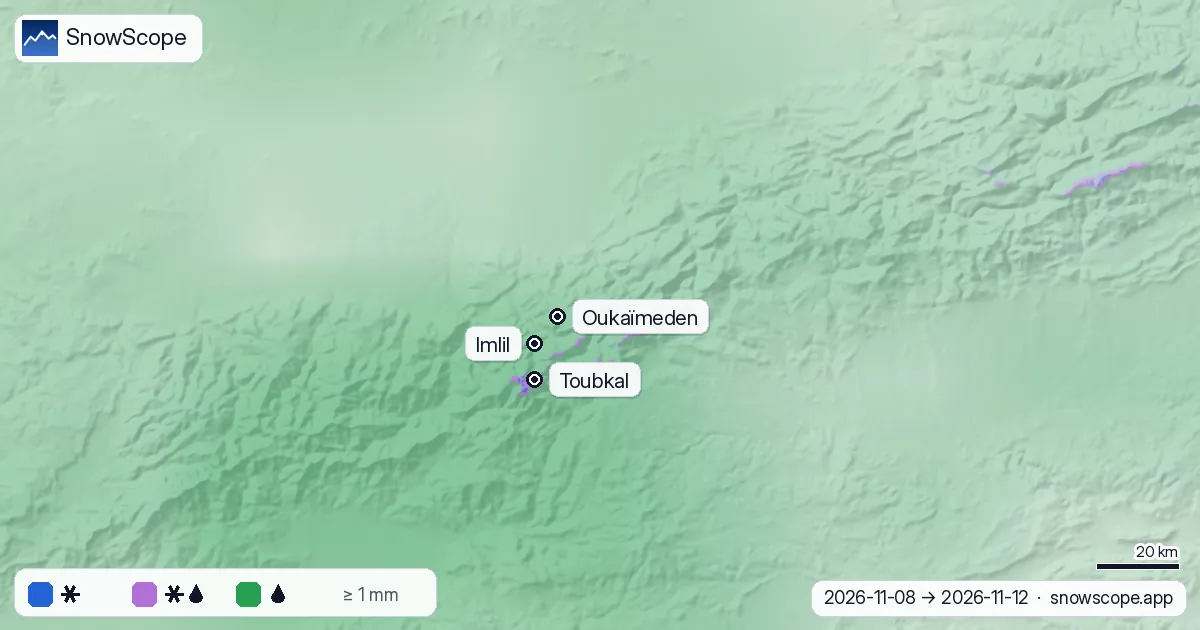
Rain is coming to the High Atlas, but the air is warm. From 8 to 12 November the snow line should stay near 3,710 m. Oukaïmeden (top 3,258 m) gets 20.1 mm, all of it as rain; only the highest summits, with Toubkal at 4,167 m, should turn white.
See the live snow forecast for Oukaïmeden in the SnowScope appSnow depth, powder alerts and the 3D map, free.
A snow line above the ski area
Over the wet hours the snow line across the range stays in a narrow band, between 3,640 and 3,800 m. Our chart by height makes the cut very clear: at 3,500 m, 86 % of the precipitation falls as rain; at 3,750 m almost all of it is wet snow or sleet; at 4,000 m, 97 % is snow.
That leaves the whole ski area of Oukaïmeden below the snow line. Imlil, at 1,740 m in the valley, gets 19.5 mm of rain.

Show the numbers
| Height (m) | Snow % | Wet snow / sleet % | Rain % |
|---|---|---|---|
| 500 | 0 | 0 | 100 |
| 750 | 0 | 0 | 100 |
| 1,000 | 0 | 0 | 100 |
| 1,250 | 0 | 0 | 100 |
| 1,500 | 0 | 0 | 100 |
| 1,750 | 0 | 0 | 100 |
| 2,000 | 0 | 0 | 100 |
| 2,250 | 0 | 0 | 100 |
| 2,500 | 0 | 0 | 100 |
| 2,750 | 0 | 0 | 100 |
| 3,000 | 0 | 0 | 100 |
| 3,250 | 0 | 0 | 100 |
| 3,500 | 0 | 14 | 86 |
| 3,750 | 3 | 97 | 0 |
| 4,000 | 97 | 3 | 0 |
Toubkal: the wettest and the whitest
The summit area of Toubkal gets the most: 78.6 mm of precipitation from 8 to 12 November. During the wet hours the 0 °C level there stands near 4,150 m, so the snow line is near 3,850 m and about 88 % of it should fall as snow on the very top.
Is it late for snow? Not yet. Our model gives 0 cm at 2,929 m at Oukaïmeden on 7 November, and in the middle of 46 past winters there was also 0 cm on this date. Last winter the snow there peaked at 132.3 cm on 24 January 2026.

Show the numbers
| Date | This winter (cm) | Last winter (cm) | Middle of past winters (cm) | Usual range (cm) |
|---|---|---|---|---|
| 10-01 | – | 0 | 0 | 0–0 |
| 10-15 | – | 0 | 0 | 0–0 |
| 11-01 | 0 | 0 | 0 | 0–14 |
| 11-15 | – | 0 | 0 | 0–37 |
| 12-01 | – | 12 | 12 | 0–46 |
| 12-15 | – | 33 | 18 | 0–54 |
| 01-01 | – | 74 | 23 | 0–53 |
| 01-15 | – | 97 | 30 | 0–74 |
| 02-01 | – | 115 | 34 | 2–94 |
| 02-15 | – | 95 | 43 | 2–102 |
| 03-01 | – | – | 56 | 5–113 |
| 03-15 | – | 85 | 53 | 0–109 |
| 04-01 | – | 112 | 31 | 0–112 |
| 04-15 | – | 107 | 5 | 0–107 |
| 05-01 | – | 0 | 0 | 0–48 |
| 05-15 | – | 0 | 0 | 0–2 |
Why the snow line is so high
Air cools by about 6.5 °C per kilometre of height. With a warm air mass over Morocco, the 0 °C level climbs close to the highest summits. Snowflakes that fall through warmer air melt and usually turn to rain about 300 m below the 0 °C level.
The map applies this rule to the real terrain, hour by hour: blue where it should snow, lilac for wet snow, green for rain. In a colder storm the same map turns blue much lower down.
What it means for you
- Hiking towards Toubkal: wet snow and ice near the summit, rain and swollen streams lower down.
- Forecasts change: look at the live snow map again before you go.
- In the mountains, follow the official weather warnings.
References and credits
- Minder, J. R., Durran, D. R. and Roe, G. H. (2011). Mesoscale controls on the mountainside snow line. Journal of the Atmospheric Sciences 68, 2107-2127. doi.org/10.1175/JAS-D-10-05006.1
- NOAA, NASA, US Air Force (1976). U.S. Standard Atmosphere, 1976 (temperature falls 6.5 °C per km in the lower atmosphere). NASA-TM-X-74335. ntrs.nasa.gov/citations/19770009539
- American Meteorological Society, Glossary of Meteorology: 'Freezing level'. glossary.ametsoc.org/wiki/Freezing_level
- American Meteorological Society, Glossary of Meteorology: 'Melting layer'. glossary.ametsoc.org/wiki/Melting_layer
- Muñoz Sabater, J. (2019). ERA5-Land hourly data from 1950 to present. Copernicus Climate Change Service (C3S) Climate Data Store. doi:10.24381/cds.e2161bac doi.org/10.24381/cds.e2161bac
- Open-Meteo.com forecast API, ECMWF IFS 0.25° model (CC BY 4.0): hourly precipitation and temperature on pressure levels. open-meteo.com/en/docs/ecmwf-api
- SnowScope snow model and forecast maps (SnowScope, Atlas Labs). snowscope.app/
About these numbers
Forecast of 7 November (ECMWF IFS via Open-Meteo): hourly precipitation and the temperature profile on 8 pressure levels at 54 points over the High Atlas. Snow line = 0 °C level minus 300 m, wet snow within 150 m of it. Snow depth: SnowScope snow model; past winters from a reanalysis archive since 1980, adjusted to the height.
Cite this report
For research, teaching or the press: the numbers and charts are free to reuse under CC BY 4.0 with this citation.
SnowScope (2026), High Atlas: rain up to about 3,710 m – only the highest summits turn white, https://snowscope.app/blog/en/2026/11/high-atlas-snow-line-rain-up-to-3700-m-8-november-2026.html, accessed 2026-11-08
SnowScope (Atlas Labs). (2026, November 8). High Atlas: rain up to about 3,710 m – only the highest summits turn white. SnowScope snow reports. https://snowscope.app/blog/en/2026/11/high-atlas-snow-line-rain-up-to-3700-m-8-november-2026.html
BibTeX
@misc{snowscope2026highatlassnowlinerainupt,
  author       = {{SnowScope (Atlas Labs)}},
  title        = {High Atlas: rain up to about 3,710 m – only the highest summits turn white},
  year         = {2026},
  month        = nov,
  howpublished = {\url{https://snowscope.app/blog/en/2026/11/high-atlas-snow-line-rain-up-to-3700-m-8-november-2026.html}},
  note         = {Published 2026-11-08 10:05 UTC; accessed 2026-11-08}
}· CC BY 4.0 · Methods, data and tools →
Follow Oukaïmeden
Free: a message when fresh snow is coming, and the forecast every morning.

More snow reports
A practical notebook on Oukaïmeden in the High Atlas: when snow usually comes, how much, which slopes to aim for and how to get there from Marrakesh.
Whistler Blackcomb gained 24 cm in one week to 50 cm total; 62 cm more forecast in 72 hours as major storms hit mountains (8 November data).
Skiing Lake Louise early in the season: why it starts early, what November and December snow usually looks like in 46 past winters, and how to ski thin early cover.