 SnowScope
MODIS snow cover in the US West: snow line from 6,600 ft in the Cascades to 10,500 ft in the southern Rockies (13 November 2026)
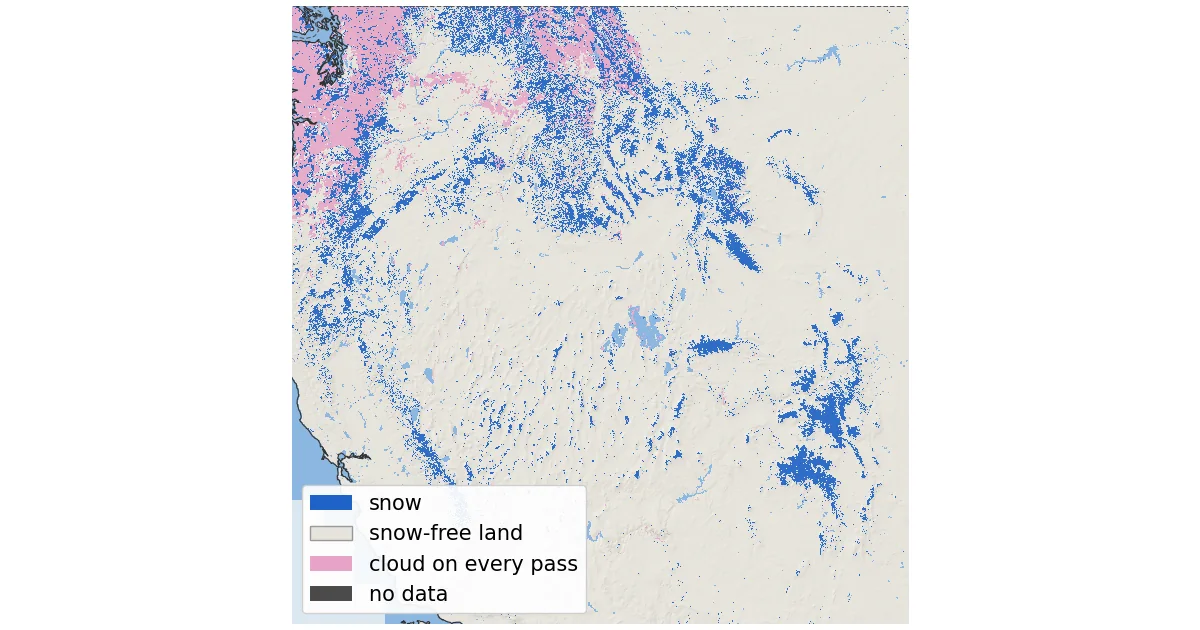
Where is the snow in the western US right now, seen from space? We decoded NASA's daily MODIS snow maps for every 500 m pixel from the Pacific coast to the Front Range. Taking the latest clear look at each pixel up to 13 November 2026, MODIS saw snow on 151,099 km² (58,340 sq mi) of ground above 1,500 m (4,900 ft). That is only 11 % of the high ground: this is still early-season snow, and its lower edge sits very high in the south.
See the live snow forecast for Western US mountains in the SnowScope appSnow depth, powder alerts and the 3D map, free.
A mostly clear week over the West
MODIS flies on two NASA satellites: Terra crosses in the morning and Aqua in the early afternoon. Each sees the West once a day with pixels of about 500 m. With both passes combined, cloud covered between 20 % and 43 % of the high ground on each day from 4 to 12 November. The clearest day was 11 November, with 20 % cloud. On 13 November only Terra's map was out when we read the data (Aqua's had not been published yet), and it showed 86 % cloud.
We therefore built a composite: for each pixel, the most recent day on which Terra or Aqua saw the ground clearly. Clear pixels within 3 pixels (about 1.5 km) of a cloud on the same pass count as cloud, because cloud edges are where false snow most often appears. The composite is recent: 65 % of the high ground was last seen on 12 November, 14 % on 13 November and 11 % on 11 November. Only 1.9 % stayed under cloud on every pass, mostly in the Cascades and northern Idaho.
The box runs from 34 to 49° N and from 124 to 104° W, and we count only ground at 1,500 m (4,900 ft) or higher, using Copernicus GLO-90 heights: 1,346,708 km² in all. That includes high plains and basins in Wyoming and Colorado, not only mountains, which is why the share of white ground looks small.
Range by range: where the white ground starts
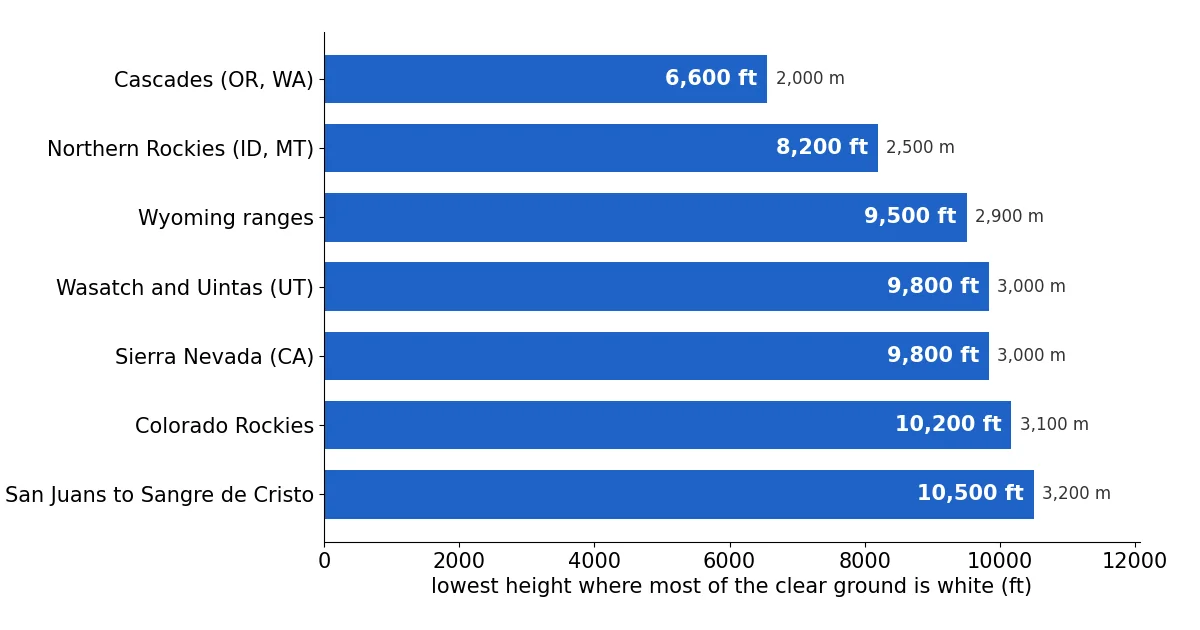
For each range we looked for the lowest height above which more than half of the clear ground was white, in 100 m steps. The Cascades of Oregon and Washington start lowest, at about 6,600 ft (2,000 m), and 38 % of their clear ground above 4,900 ft was white, although 72 % of that ground was seen clearly at all. In the northern Rockies of Idaho and Montana the line sits at about 8,200 ft (2,500 m), with 31 % white.
Further south the snow is only on the high peaks. The Wyoming ranges start at about 9,500 ft (2,900 m). The Wasatch and Uintas of Utah and the Sierra Nevada of California both sit at about 9,800 ft (3,000 m) in the satellite view, with 11 % and 15 % of their high ground white (the Sierra stations below tell a different story). The Colorado Rockies start at about 10,200 ft (3,100 m), with 22 % white, and the ranges from the San Juans to the Sangre de Cristo in New Mexico at about 10,500 ft (3,200 m).
Across the whole box, only 6 % of the clear ground between 1,500 and 2,250 m was white. The share reached 36 % between 2,750 and 3,000 m, 63 % between 3,000 and 3,250 m and 92 % between 3,500 and 3,750 m. Above 3,750 m (12,300 ft) nearly all clear ground was white.
The science in one ratio: the NDSI
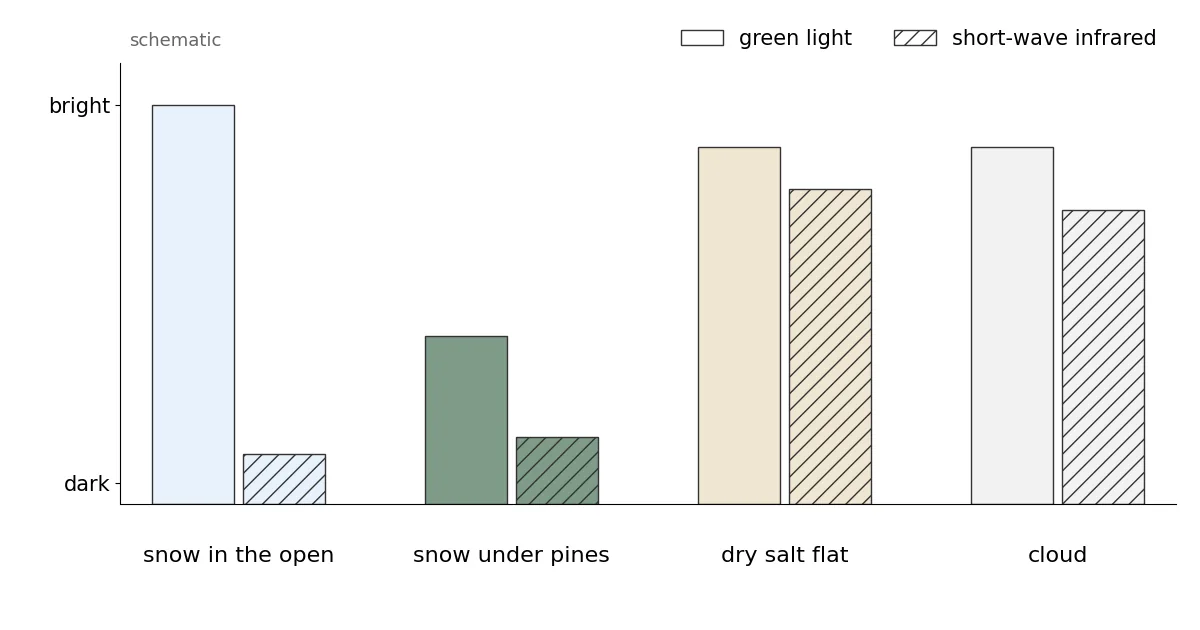
Snow is bright in green light and dark in the short-wave infrared near 1.6 µm, because ice absorbs strongly there. Most clouds are bright in both, while rock, soil and plants are fairly dark in green. The Normalized Difference Snow Index turns this into one number: NDSI = (green − SWIR) / (green + SWIR), using MODIS band 4 and band 6. Snow gives a high positive value.
NASA's Collection 6.1 algorithm flags snow where the NDSI is above zero, then removes doubtful cases. It rejects NDSI values below 0.1, reverses snow on warm ground below 1,300 m and takes clouds from a separate MODIS cloud mask. Each pixel gets an 'NDSI snow cover' value from 0 to 100, which is not the percentage of the pixel under snow: fractional snow cover is not calculated in Collection 6.1. Here, 1 to 100 counts as snow. On Aqua, about 75 % of the band 6 detectors do not work; NASA rebuilds that band, so since Collection 6 both satellites use band 6.
The West has its own traps. Under a dense conifer forest the satellite sees the green crowns, not the snow below, so forest snow is often missed. Bright, dry salt flats like Bonneville can look snow-like; the guide names them as an example of what the temperature screen removes when the ground is warm, but not always when it is cold. And thin, icy cirrus can pass as snow.
Checked on the ground: SNOTEL stations and local reports
The NRCS SNOTEL network measures snow depth at automatic stations across the western mountains. We matched every station reading from 4 to 12 November with the MODIS pixel of the same day, whenever the satellite had a clear view there: 3,766 station-days. Satellite and station agree 77.5 % of the time. MODIS saw snow at a bare station 477 times and missed snow at a snowy station 370 times; the misses are mostly thin, patchy snow, which a 500 m pixel can easily average away.
Range by range on 12 November, the satellite snow lines hold up well. Above them, most stations had snow: 49 of 63 in Colorado, 36 of 44 in the northern Rockies, 15 of 17 in Wyoming and 7 of 8 in Utah. Below them, most were bare: only 7 of 52 stations in Utah and 11 of 106 in the Cascades had snow.
The Sierra Nevada is the exception, and the stations correct us there. No SNOTEL station sits above our 9,800 ft line, but 16 of the 24 stations at 2,300 m (7,500 ft) or higher had 1 to 8 inches of snow on 12 November, and none of the 11 lower ones did. So the Sierra had a thin early cover from about 7,500 ft that MODIS mostly did not count as white.
Local news fits the picture of a thin start. CBS Colorado reported on 6 November that Breckenridge delayed its opening because it wanted a deeper base, while Copper Mountain got four inches of snow overnight. In New Mexico, KOB expected up to an inch of snow in the far northern mountains on 4 November and little or none lower down. In Utah, KSL wrote on 13 November that storms were returning after a lull.
MODIS and the SnowScope map agree closely
We compared MODIS on 12 November with the SnowScope snow map for the same day. On 1,021,095 km² of high ground that MODIS saw clearly, the two agree on 95.5 % of the area. MODIS saw snow where our map is bare on 3.0 % of it, and our map has snow where MODIS saw bare ground on 1.5 %. MODIS counted 68,147 km² of snow in the compared area, our map 52,780 km².
Treat this as a consistency check, not an independent test: our map already removes snow where a recent clear MODIS look shows bare ground. The remaining gap is mostly thin snow at the edges of the snowpack and under forest, which MODIS and our map handle differently.
Tips for skiers
- For early-season trips, aim for terrain above the snow line of the range: about 9,800 ft in Utah and 10,200 ft in Colorado. In the Sierra, the stations show thin snow from about 7,500 ft.
- In forested terrain, expect snow where the open slopes nearby are white, even if the satellite shows the forest as bare.
- Check the date of the last clear look before trusting a satellite snow map after a storm.
More maps (external sites)
References and credits
- Riggs, G.A., Hall, D.K. and Román, M.O. (2019). MODIS Snow Products Collection 6.1 User Guide, version 1.0. NASA / NSIDC nsidc.org/sites/default/files/c61_modis_snow_user_guide.pdf
- Hall, D.K., Riggs, G.A., Salomonson, V.V., DiGirolamo, N.E. and Bayr, K.J. (2002). MODIS snow-cover products. Remote Sensing of Environment 83, 181-194 doi.org/10.1016/S0034-4257(02)00095-0
- Hall, D.K. and Riggs, G.A. (2011). Normalized-Difference Snow Index (NDSI). Encyclopedia of Snow, Ice and Glaciers, Springer doi.org/10.1007/978-90-481-2642-2_376
- NSIDC: MODIS/Terra Snow Cover Daily L3 Global 500m Grid, Version 61 (MOD10A1) nsidc.org/data/mod10a1/versions/61
- NASA EOSDIS Global Imagery Browse Services (GIBS): layers MODIS_Terra_NDSI_Snow_Cover and MODIS_Aqua_NDSI_Snow_Cover (from MOD10_L2 / MYD10_L2, Collection 6.1) and their colour map www.earthdata.nasa.gov/engage/open-data-services-software/earthdata-developer-portal/gibs-api
- Copernicus DEM GLO-90 (European Space Agency, Copernicus programme) doi.org/10.5270/ESA-c5d3d65
- USDA NRCS SNOTEL network, daily snow depth (Air and Water Database) www.nrcs.usda.gov/resources/data-and-reports/snow-and-water-interactive-map
- CBS Colorado (6 November 2026): Breckenridge delays opening in Colorado mountains due to too warm overnight temps www.cbsnews.com/colorado/news/breckenridge-delays-opening-colorado-mountains-too-warm-overnight-temps/
- KOB 4 (4 November 2026): Cold front brings strong winds, winter weather to parts of New Mexico www.kob.com/new-mexico/cold-front-brings-strong-winds-winter-weather-to-parts-of-new-mexico/
- KSL (13 November 2026): Advisory issued as rain, snow return to Utah after recent lull www.ksl.com/article/51645676/advisory-issued-as-rain-snow-return-to-utah-after-recent-lull
About these numbers
Data: NASA GIBS daily layers MODIS_Terra_NDSI_Snow_Cover and MODIS_Aqua_NDSI_Snow_Cover (built from MOD10_L2 / MYD10_L2, Collection 6.1, near-real-time), 500 m tile set, decoded with the layer's published colour map back to the product values. Snow = 1 to 100, snow-free = 0. Daily: Terra where clear, else Aqua; clear pixels within 3 pixels of cloud on the same pass counted as cloud. Composite: latest clear look per pixel, 4 to 13 November 2026 (Aqua for 13 November not yet published when read). Areas use the true pixel size at each latitude. Box 34 to 49° N, 124 to 104° W, ground at or above 1,500 m (Copernicus GLO-90). Range boxes: Sierra Nevada 35.4-40.4° N 121.4-117.6° W; Cascades 42-49° N 122.6-120.4° W; northern Rockies 43-49° N 117-109° W; Wyoming 41-45° N 111.2-106° W; Wasatch-Uintas 39.5-41.2° N 112.2-109.5° W; Colorado 37-41° N 108.6-104.9° W; San Juans to Sangre de Cristo 35-38° N 108-104.5° W. Snow line: lowest 100 m band above which every band with enough clear ground is more than half white. SnowScope comparison: the 500 m SnowScope map of 12 November, depth of 1 cm or more = snow.
Cite this report
For research, teaching or the press: the numbers and charts are free to reuse under CC BY 4.0 with this citation.
SnowScope (2026), MODIS snow cover in the US West: snow line from 6,600 ft in the Cascades to 10,500 ft in the southern Rockies (13 November 2026), https://snowscope.app/blog/en/2026/11/modis-snow-cover-us-west-13-november-2026.html, accessed 2026-11-13
SnowScope (Atlas Labs). (2026, November 13). MODIS snow cover in the US West: snow line from 6,600 ft in the Cascades to 10,500 ft in the southern Rockies (13 November 2026). SnowScope snow reports. https://snowscope.app/blog/en/2026/11/modis-snow-cover-us-west-13-november-2026.html
BibTeX
@misc{snowscope2026modissnowcoveruswest13no,
  author       = {{SnowScope (Atlas Labs)}},
  title        = {MODIS snow cover in the US West: snow line from 6,600 ft in the Cascades to 10,500 ft in the southern Rockies (13 November 2026)},
  year         = {2026},
  month        = nov,
  howpublished = {\url{https://snowscope.app/blog/en/2026/11/modis-snow-cover-us-west-13-november-2026.html}},
  note         = {Published 2026-11-14 13:29 UTC; accessed 2026-11-13}
}· CC BY 4.0 · Methods, data and tools →
Follow Western US mountains
Free: a message when fresh snow is coming, and the forecast every morning.

More snow reports
Mt Baker, Washington: about 133 in (337 cm) at the usual peak at mid-mountain in 46 past winters, a world snowfall record, no lodging on the hill, and what that means.
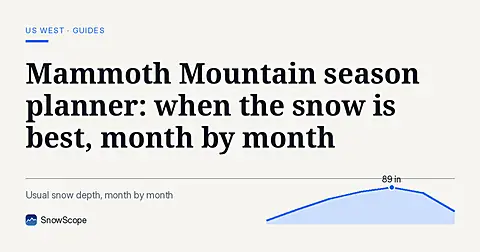
Plan Mammoth Mountain by season: about 93 in (235 cm) at the usual peak at mid-mountain over 46 past winters, March deepest, long springs, and winters that swing.
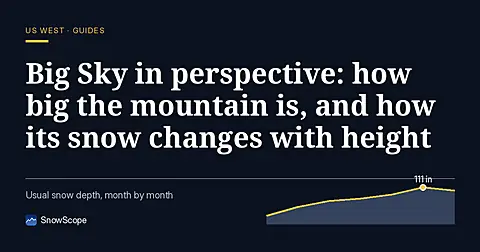
Big Sky, Montana, made easy to picture: 5,850 acres under Lone Peak, and snow that is about five times deeper near the top than at the base in 46 past winters.