 SnowScope
A river in the sky over Whistler: why the top gets a metre of snow and the base gets rain
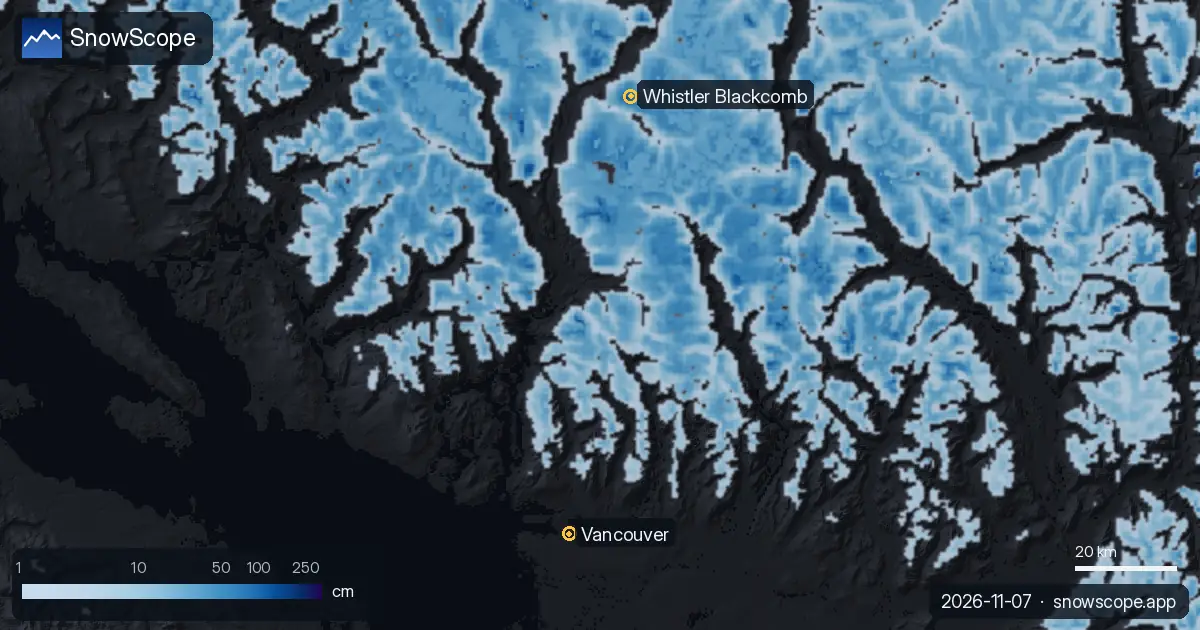
A train of Pacific storms, fed by an atmospheric river, hits the Coast Mountains from 7 to 12 November. Our forecast shows about 103 cm of new snow at Whistler Blackcomb by 10 November, but the 0 °C level swings between about 1,410 and 2,920 m: deep snow up high, rain at the base, and a warm spell on Wednesday 11 November.
See the live snow forecast for Whistler Blackcomb in the SnowScope appSnow depth, powder alerts and the 3D map, free.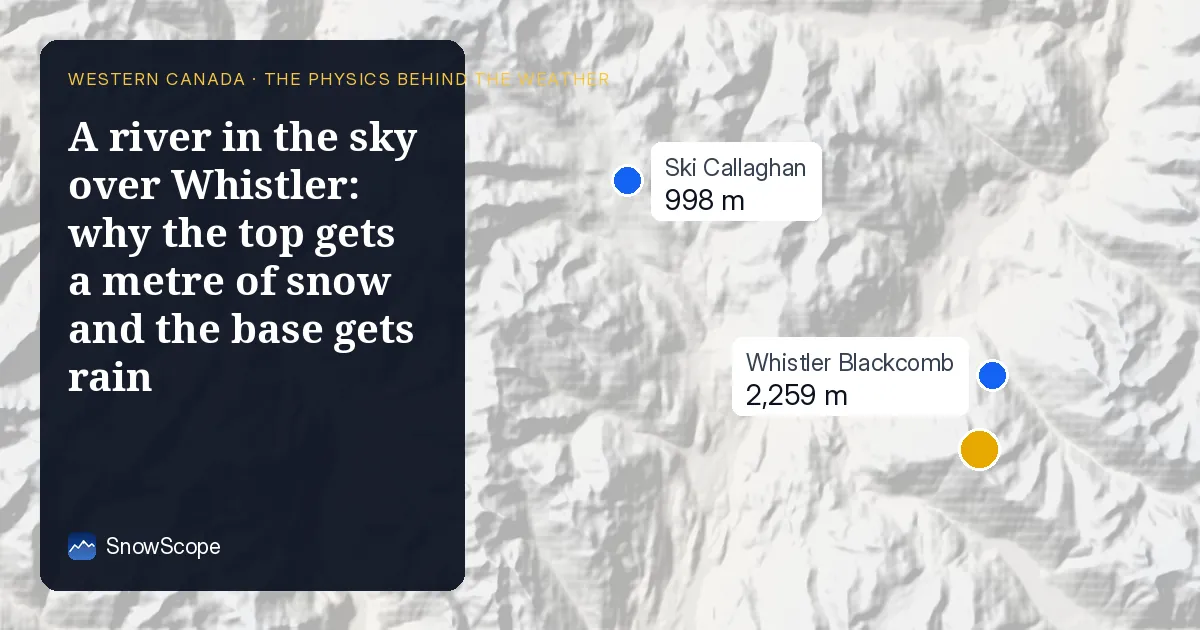
The numbers
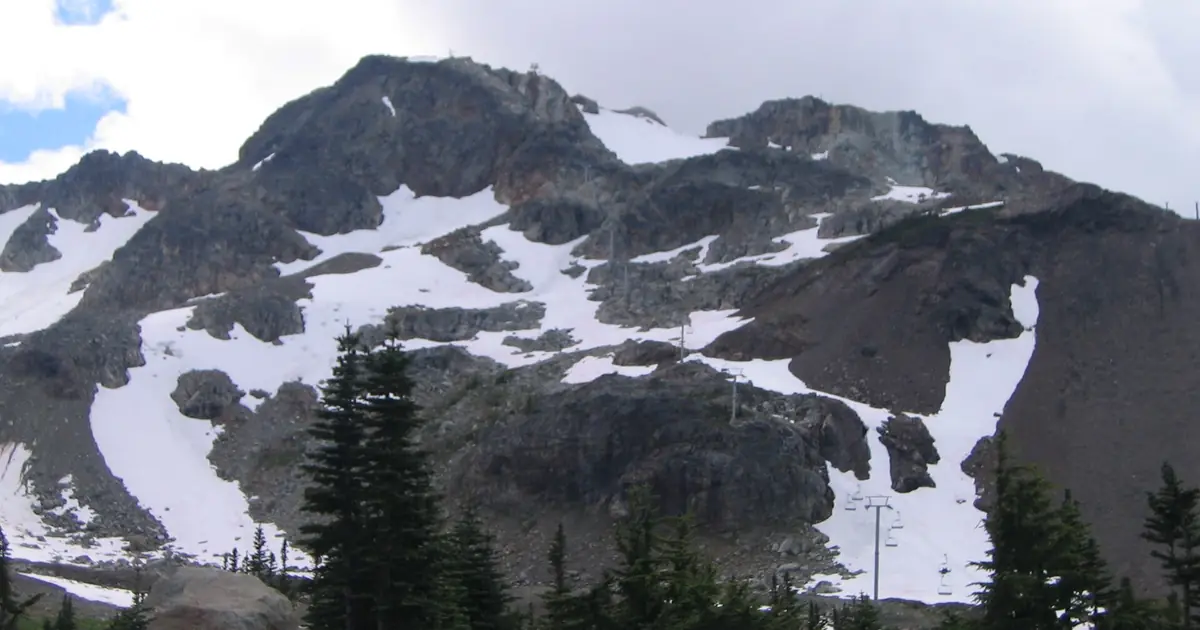
On Whistler's upper slopes (2,284 m) our forecast of 7 November gives about 192 mm of water from 7 to 12 November: 56 mm on Sunday 8, 21 mm on Tuesday 10, 40 mm on Wednesday 11 and 73 mm on Thursday 12. For the 72 hours to 10 November our snow forecast gives +103 cm at Whistler Blackcomb, +99 cm at Ski Callaghan and +74 cm at Mount Cain on Vancouver Island, with the snow line near 1,300 m.
Down at sea level the same storms mean rain: about 135 mm in Vancouver over the six days, and up to 17 °C on Wednesday 11 November.
A river in the sky
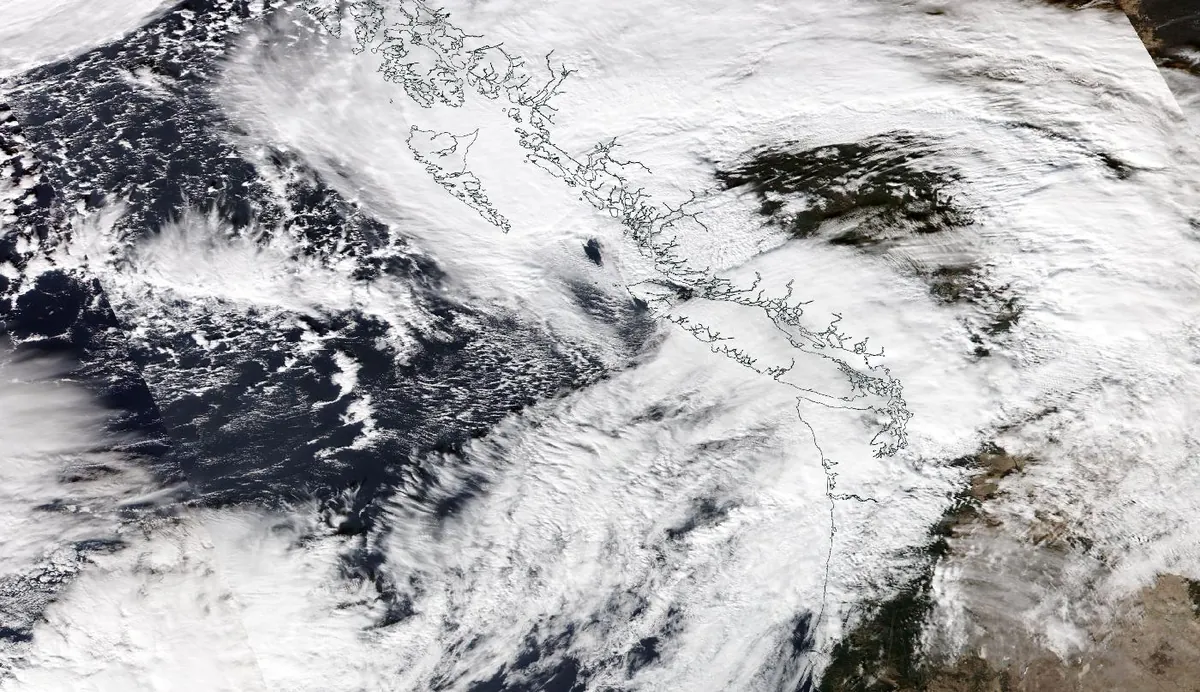
An atmospheric river is a long, narrow corridor of air, low in the atmosphere, that carries a huge amount of water vapour, usually just ahead of a cold front. Meteorologists measure it as the flow of vapour carried by the wind: above 250 kg of water per metre per second it counts as an atmospheric river, above 750 as a strong one.
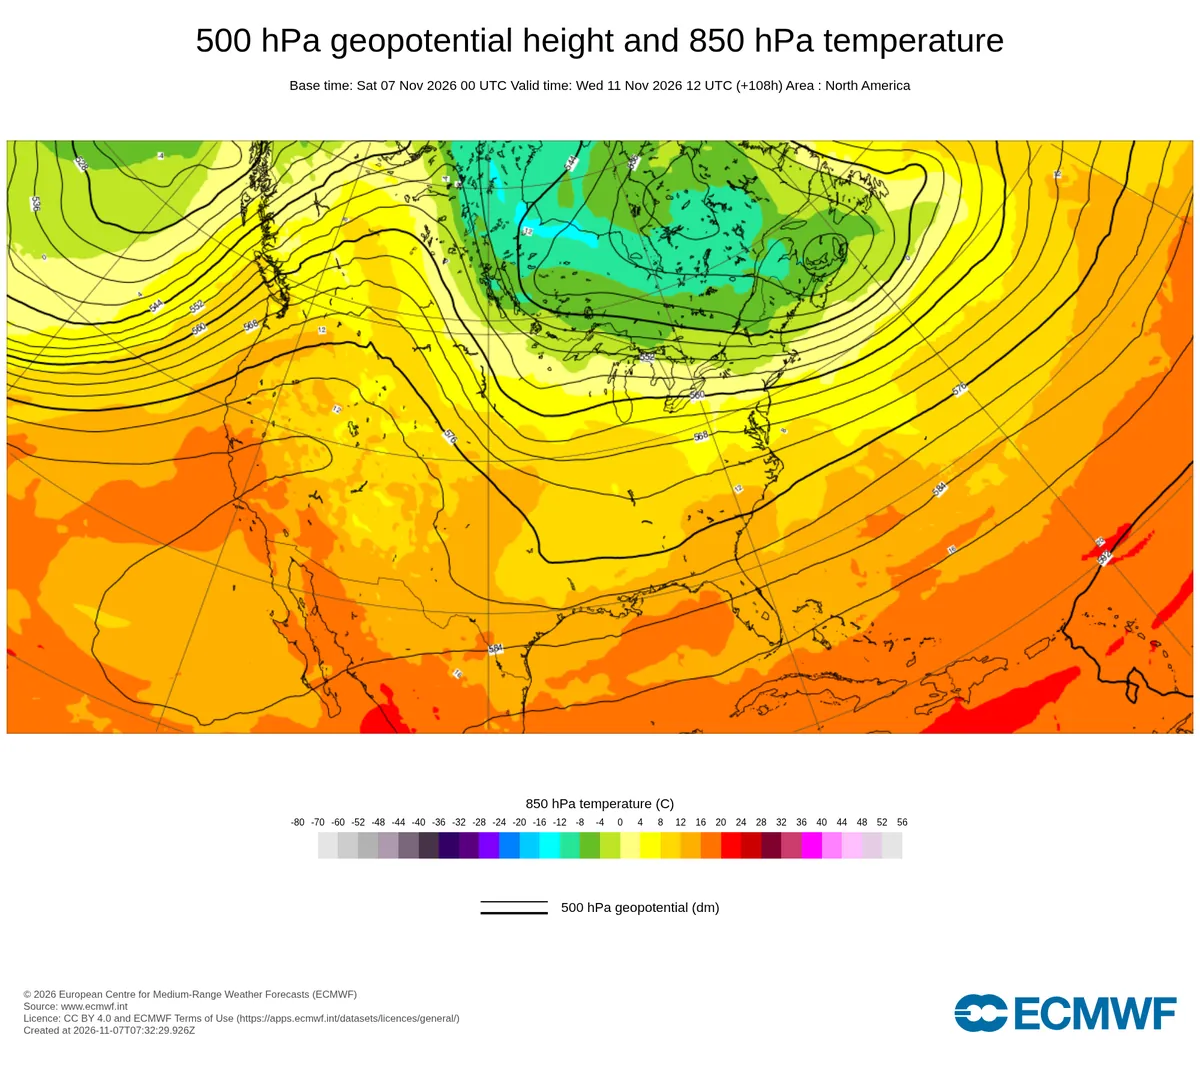
Off Vancouver Island we estimate this flow at about 946 on Saturday 7 November and about 987 on Wednesday 11 November, and above 250 for 95 hours of the six days. The jet stream points straight at the coast: at about 3 km up the wind over the ocean reaches 132 km/h, from the south-west.
Why the Coast Mountains squeeze out so much
When this wet air reaches the Coast Mountains it is forced to rise. Rising air expands and cools, its vapour condenses into cloud and falls out as rain or snow. That is orographic lift, and it explains the gradient in our numbers: about 109 mm over the ocean off Vancouver Island, 135 mm in Vancouver, 192 mm on Whistler's upper slopes.
Once the air has crossed the main ridges it has lost much of its water and sinks again, which is why valleys further inland, in the rain shadow, get far less.
Snow at the top, rain at the base: the snow line
Air cools with height, about 6.5 °C per km in the standard atmosphere; in this moist air we find about +3 °C at 1,400 m and about -4 °C at 3,000 m during the wet hours. The 0 °C level is where the air crosses freezing. Snowflakes falling below it start to melt and need a few hundred metres to melt completely, so the snow line sits about 300 m below the 0 °C level.
That level moves a lot from day to day: 1,310 to 1,680 m on Monday 9, 1,500 to 2,430 m on Sunday 8, then 2,390 to 2,920 m on Wednesday 11, when the warm air of the atmospheric river arrives, and 1,730 to 2,490 m on Thursday 12. Weighted by the precipitation, the 0 °C level is near 2,090 m and the snow line near 1,790 m; about 88 % of the water that falls on the upper mountain should fall as snow. The base at 675 m sees rain almost all the time.
On Wednesday the 0 °C level climbs to or above the summits: expect rain or very wet snow high up, before colder air brings snow back on Thursday.
What it means for skiers
Snow from an atmospheric river is heavy and wet: it builds a solid base quickly, but rain and warmth on Wednesday will make a crust at lower and middle heights, buried by new snow on Thursday. Rapid loading plus warming is a classic recipe for rising avalanche danger.
Forecasts change, especially the height of the snow line. Check the snow map, and read Avalanche Canada's forecast before going out of bounds.
What it means for you
- The best snow will be high: above about 1,800 m the storm falls mostly as snow, below it mostly as rain.
- Wednesday 11 November is the warm day: rain or wet snow even high up; the colder snow returns on Thursday.
- Expect a crust under the new snow at middle heights after Wednesday.
- Out of bounds: always read the official avalanche forecast first; heavy loading and warming raise the danger.
More maps (external sites)
References and credits
- Ralph, F. M., Dettinger, M. D., Cairns, M. M., Galarneau, T. J. and Eylander, J. (2018). Defining 'atmospheric river': how the Glossary of Meteorology helped resolve a debate. Bulletin of the American Meteorological Society 99, 837-839. doi.org/10.1175/BAMS-D-17-0157.1
- Ralph, F. M., Rutz, J. J., Cordeira, J. M., Dettinger, M. D. et al. (2019). A scale to characterize the strength and impacts of atmospheric rivers. Bulletin of the American Meteorological Society 100, 269-289. doi.org/10.1175/BAMS-D-18-0023.1
- Ralph, F. M., Neiman, P. J. and Wick, G. A. (2004). Satellite and CALJET aircraft observations of atmospheric rivers over the eastern North Pacific Ocean during the winter of 1997/98. Monthly Weather Review 132, 1721-1745. doi.org/10.1175/1520-0493(2004)132%3C1721:SACAOO%3E2.0.CO;2
- Guan, B., Molotch, N. P., Waliser, D. E., Fetzer, E. J. and Neiman, P. J. (2010). Extreme snowfall events linked to atmospheric rivers and surface air temperature via satellite measurements. Geophysical Research Letters 37, L20401. doi.org/10.1029/2010GL044696
- Roe, G. H. (2005). Orographic precipitation. Annual Review of Earth and Planetary Sciences 33, 645-671. doi.org/10.1146/annurev.earth.33.092203.122541
- Minder, J. R., Durran, D. R. and Roe, G. H. (2011). Mesoscale controls on the mountainside snow line. Journal of the Atmospheric Sciences 68, 2107-2127. doi.org/10.1175/JAS-D-10-05006.1
- Wallace, J. M. and Hobbs, P. V. (2006). Atmospheric Science: An Introductory Survey, 2nd edition. Academic Press / Elsevier. ISBN 978-0-12-732951-2.
- American Meteorological Society, Glossary of Meteorology: 'Atmospheric river'. glossary.ametsoc.org/wiki/Atmospheric_river
- American Meteorological Society, Glossary of Meteorology: 'Freezing level'. glossary.ametsoc.org/wiki/Freezing_level
- American Meteorological Society, Glossary of Meteorology: 'Rain shadow'. glossary.ametsoc.org/wiki/Rain_shadow
- Forecast data: Open-Meteo.com (CC BY 4.0) from the ECMWF IFS (CC BY 4.0), run of 7 November 2026; new snow and snow depth: SnowScope forecast and snow model; chart: ECMWF open charts (CC BY 4.0); satellite image: NASA Worldview / NASA EOSDIS. open-meteo.com/
About these numbers
Numbers: forecasts of 7 November 2026 for 7 to 12 November (precipitation, temperature and wind at several heights on Whistler's upper slopes, in Vancouver and over the ocean off Vancouver Island) and the SnowScope 72-hour snow forecast of the same day. We computed the 0 °C level from the temperature profile and took the snow line about 300 m below it; the moisture flow is estimated from wind, temperature and humidity at eight heights. Forecasts change.
Cite this report
For research, teaching or the press: the numbers and charts are free to reuse under CC BY 4.0 with this citation.
SnowScope (2026), A river in the sky over Whistler: why the top gets a metre of snow and the base gets rain, https://snowscope.app/blog/en/2026/11/whistler-atmospheric-river-physics-7-november-2026.html, accessed 2026-11-07
SnowScope (Atlas Labs). (2026, November 7). A river in the sky over Whistler: why the top gets a metre of snow and the base gets rain. SnowScope snow reports. https://snowscope.app/blog/en/2026/11/whistler-atmospheric-river-physics-7-november-2026.html
BibTeX
@misc{snowscope2026whistleratmosphericriver,
  author       = {{SnowScope (Atlas Labs)}},
  title        = {A river in the sky over Whistler: why the top gets a metre of snow and the base gets rain},
  year         = {2026},
  month        = nov,
  howpublished = {\url{https://snowscope.app/blog/en/2026/11/whistler-atmospheric-river-physics-7-november-2026.html}},
  note         = {Published 2026-11-08 17:40 UTC; accessed 2026-11-07}
}· CC BY 4.0 · Methods, data and tools →
Follow Whistler Blackcomb
Free: a message when fresh snow is coming, and the forecast every morning.

More snow reports
Western Canada's ski resorts hold snow at 18 percent of early-season norms as of November 3, with Mount Cain leading and lower elevations lagging far behind.
Whistler Blackcomb for every level, with our snow history: about 370 cm at the usual peak at mid-mountain over 46 past winters, March and April the deepest months.
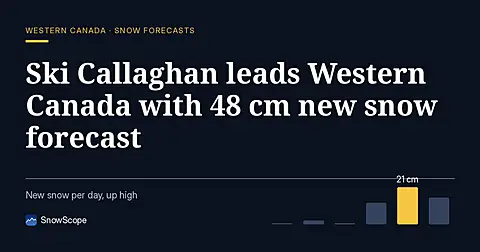
Ski Callaghan leads Western Canada forecast with 48 cm new snow through 7 November, mostly on 6th, with higher elevations capturing deeper accumulation.